
We hope that you had a wonderful Holiday Season and that your 2022 is off to a great start. We know it’s been a while, but we want to assure you that we have been working around the clock to assure the success of The Jupiter Fund and Black Mountain; which we will detail throughout this letter but here are some highlights:
• ETH, the benchmark used in our company presentation, internal metrics, and return comparisons, is down ~42% from the time we started our fund. Currently, and for the last ~2 months, the fund has been fluctuating between positive and negative 15% on average.
• In mid-January, we liquidated a small portion of our largest non-cash position at the time, Oasis Network, that was up around 77%, locking in some profits for the fund.
• We have now completed an internal audit and have been passing working books back and forth with our accountant. We are hoping to have investor tax documents finalized in the very near future, but in the meantime, we are pleased to allow current investors to login via our website to see their returns up to January 21st according to our internal audit (current investors have received personalized login information and an EOY internal audit as well).
• We have decided to lower the performance fee for The Jupiter Fund down to 20% from 35% to demonstrate further alignment with investors.
• We have also updated our deck to reflect an increase in NFT purchases, which have humbly (and subject to change) been doing exceptionally well. See updated deck here.
• Since our last email, it appears that markets and global tensions have become even more front and center, with dot-com style corrections across equities and cryptocurrencies seeing 50% drawbacks across the board.
• We also find it interesting how nonspecific Jerome Powell was in his latest remarks. Our general view is that five rate hikes (assuming 25-50bps/hike) with balance sheet reductions in 2022 would be an overreaction, but that three to four with some reductions seems reasonable/necessary.
While markets have been volatile to say the least, we have continued to DCA into many of our favorite assets at discounted prices with ROSE profits and a considerable amount of cash that we have been keeping on hand since our last email identifying some possible leading indicators to this correction, although it truly started back in November. That being said, we are expecting resilient profitability in late Q1 and are extremely optimistic about the future of The Jupiter Fund.
Jupiter Fund Update
The Jupiter Fund was set up to and is currently positioned to scale infinitely and handle any amount of capital. Our basket of cryptocurrencies, US-equities, and Web3 projects is properly diversified in important sectors and actively generating dividends and staking rewards from many of our holdings.
One of the fund’s highest-returning crypto staking rewards is Polkadot, a decentralized protocol that enables cross-blockchain transfers of any type of asset or data. Being the bridge to connect multiple blockchains, Polkadot aims to achieve its goal of high degrees of security and scalability, offering 1,000,000 TPS (transactions per second) when fully built. As seen in the image below, delegating your Polkadot to one of the 297 validators running a node is accepted as the norm by market participants, with a 99.72% participation rate. The fund is no exception to this (although in the future we would like to run our own validator); currently, however, delegating our DOT averages us ~14% APR being compounding onto our current Polkadot holdings.

In addition to receiving these monetary rewards, our delegation allows us to participate in voting to improve the Polkadot Network. The governance is a bit different than traditional blockchains, such as Ethereum, where Polkadot gives more power to small fish rather than big whales. This governance practice is known as Quadratic Voting and each vote is weighted by taking the square root of the account balance (see image below).

To prevent malicious actors splitting their tokens into multiple accounts to maximize their voting power, a snapshot of all Polkadot accounts & balances is taken so no new accounts or changes to existing account balances after the snapshot will have any influence on the vote.
The Jupiter Fund recently cast its first vote on the future of Polkadot’s brand. Over a period of roughly nine days, the DOT holders either voted for Logo A or Logo B. Through the process of Quadratic Voting, an overall voting power (VP) of 39,687 was put forward from a total of contributed 10,309,474 DOT.
The fund voted for Logo A and the results were:
• Logo A – 81% (32,272.94 VP)
• Logo B – 19% (7,413.729 VP)
Moving into our actively managed portfolio update, we’ve been working to make the most of this dip by setting lower entries for great projects after selling close to the top. An example of our long-short strategy that we’d like to highlight occurred with Oasis Network, a privacy-enabled blockchain platform for open finance and a responsible data economy. Our average buys were ~$0.28 and we sold out ~25% of our ROSE at just under $0.50, and then bought back in at the $0.28 level of support, playing both sides of the market. After selling out for a ~77% gain, the fund cash-shorted for a ~44% increase in our overall Oasis holdings at the time.
This newly minted Oasis (ROSE) and excess profits generated by our actively managed trading account were sent to the fund’s cold storage wallet, where the ROSE is being staked, averaging 10.25% APR. As the fund continues to grow and execute on more swing trades, the staking rewards will increase proportionally.
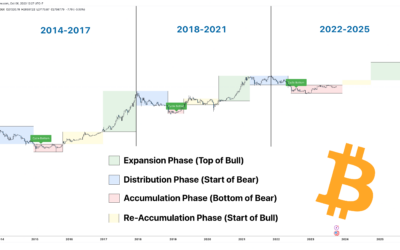
We also “bought the dip” on Bitcoin, Ethereum, and Polkadot along support levels that haven’t been touched since the summer 2021 correction (see charts below). Starting off by looking at the 2-day chart of Bitcoin, we can see major similarities between the two cycle tops & bottoms.

In the first bear market, Bitcoin caught the uptrend as well as the level of support at $30,838. From here, we saw another cycle top which lead into the next bear market.
In the second bear market, Bitcoin lost the uptrend but wicked the $33,099 level of support, closing out the CME Futures Gap, multiple liquidity gap levels, and ended up creating a higher low to confirm / continue the bullish momentum.
Looking at Ethereum on the 2-day chart (see below), we can again, just like with Bitcoin, draw major similarities between both market corrections. We noticed this range of liquidity gaps around the $2,294.27 level that got front ran in September 2021, very similar to Bitcoin’s CME Futures liquidity gap at $33,099. Using this information, we placed our Ethereum orders at $2,294.27 and patiently waited for that liquidity gap to fill. As expected, Ethereum swiftly reversed after closing the liquidity gap at $2,294.27 and hasn’t touched that price since (knock on wood).

We now have stop-losses placed for Ethereum in the profits after filling at $2,294.27 and, while not impossible, we believe it would take a lot of liquidity to push the price back down and wick $2,294.27 again.
Crypto Market Update
Bitcoin and other cryptocurrencies have had a rocky start to the year due to major global news events and a hawkish stance by the Federal Reserve in the wake of inflation and historically high assets prices across the board over the last couple years. In this update, we’ll analyze data and consider future bullish/bearish signs.
While Bitcoin has historically been uncorrelated to other asset classes such as US equities, gold, and bonds, since the start of March 2020, Bitcoin’s yearly correlation to the S&P has consistently been positive (see graph below). In this environment of excess capital, it appears that the correlation between the two has increased. But with expected tighter monetary policy in the near future, it will be interesting to observe how the macro backdrop will affect the underlying spot price of Bitcoin, other assets, and their respective correlations to each other.

As mentioned in our Mid-December Market Update, Bitcoin had just fallen below the Bull Market Support Band as well as the 50-week moving average. It’s typically not a good sign to see price fall below these moving averages as it shows a shift in order flow, bearish market structure as well as a large change in market sentiment for long-term investors and traders. Bitcoin was around $46,000 on the weekly close of our last newsletter and we had mentioned the untested liquidity, also known as a “liquidity gap,” around $40,707.64 that had yet to be tested. After three weeks of seeing a rebalance, the markets began to sell off to $40,707.64, and then a few days later sold off even further to $33,099 (see graph below). Bitcoin, as well as many alt coins, are down 40%-45% since their peaks in early November, leaving many wondering what we will see in the upcoming months.

While the average trader was longing through these dips and providing liquidity to the markets, BMIG decided to be patient and instead of allocating all our capital at once, stuck to our preferred method of dollar cost averaging. This is an especially good way to navigate these choppy markets since it’s very tricky and too early to determine an exact bottom. Although these crypto markets are extremely volatile, what we are seeing is nothing we haven’t seen in the past. Bitcoin has had many corrections in a bull market before, but over time it continues to bounce higher and higher. For example, during the 2016/2017 bull market, Bitcoin had over five 35% corrections, leaving many in disbelief that it could rally higher during those times. Although we have seen two 50% corrections during in 2021/2022, we still believe that this market cycle has yet to fully peak.
Looking at Bitcoin on the weekly timeframe (see below), it is clear to see that we have been in a bearish trend for the past three months. Earlier this week, we saw Bitcoin and alt coins bounce back a bit, this being the reaction/rebalance of the liquidity gap at $36,742. Unfortunately, Bitcoin is still far from its previous all-time high and still under the bull market support band as well as the 50-week moving average.

After reacting to the liquidity gap at $36,742, bulls took control of the wheel again as we continued to create Higher-lows and Higher-highs on the lower timeframes (daily, 4-hour, 1 hour, see 4-hour chart below). As far as directional bias goes, Bitcoin closed below the monthly liquidity gap on both the weekly and monthly timeframes. The monthly candle also closed below its previous monthly low which is not the greatest indication for bulls as it shows bears are still in control on the longer timeframes. If you look at the weekly chart above, you can see Bitcoin seems to be slowly making its way up towards the monthly liquidity gap at $40,000. This level is going to be a big decision maker on what happens to Bitcoin and the rest of the crypto markets as well. For bulls to take control again, they would need to close above this level and stay above at least until weekly close to show a change in direction. If Bitcoin cannot close above $40,000 or continues creating Higher-lows and Higher-highs on the daily and 4-hour timeframe, it could continue to fall and this high become another lower high in the future.

We are expecting an increase in volatility but will not confirm a fully bullish market until Higher-highs and Higher-lows are created on a higher period. At the end of the day no one knows exactly where the market is heading in the short/mid/long-term. We say this partially because there are still many un-tested liquidity gaps/ranges that allowed us to reach the ATHs seen in 2021. The closest one being at $30,845, which is the gap of the summer reversal. Another key factor is that even in a bear trend we can still have green days/weeks (these are Lower-highs) similar to what we saw in December, as many traders and investors were calling bottom; those traders then became liquidity providers for shorts. Moving forward, we will be continuing to dollar cost average into positions but also be watching out for the unexpected.
Additional Learnings / Perspectives
A on-chain metric we like to look at is Bitcoin’s “Exchange Net Position Change.” This graph (seen below) represents where large players are holding their Bitcoin, either in cold wallets or exchanges. The green data depicts Bitcoin coming onto exchanges, while red shows Bitcoin being offloaded exchanges into cold wallets. Typically, when investors are sending their Bitcoin back to exchanges, it’s a sign that they are selling and expecting lower prices. While on the other hand, when Bitcoin is being sent from exchanges to cold wallets, it’s a sign that coins are being held and holders are expecting prices to increase. At the moment, we are starting to see a slight increase in Bitcoin being sent off exchanges and back into cold wallets after this dip. Although on-chain metrics should not be used to decide whether or not to enter a trade, it does give some interesting insights on how large players are moving money in different markets.

“Open Interest” is another on-chain metric to look at, especially during choppy markets times like these. Open interest shows the amount of leverage being used across exchanges (see below). There will always be open interest, but when open interest is too high, we typically see “tops,” and signs of a sell off coming- as seen shortly before May 2021 and Jan 2022. Currently, open interest is decreasing slowly but surely as traders are getting liquidated and exiting the markets. Again, like exchange net position, open interest does not give a clear signal whether to buy or sell, but it does give an indication of how volatile the markets will be and how much of an impact leveraged traders will be to price action.

Thank you for taking the time to read this. As always, please feel free to reach out to us if you have any questions, concerns, or feedback.
Hope you have a wonderful week.
Best,
Kyle, Thawon, and Elijah


0 Comments